
AUTOMOTIVE FP&A CASE STUDY5 Business Segments1,000s of Planning Rows
Automating Business Plan & Rolling Forecast Reporting
How a large automotive manufacturing and distribution enterprise replaced spreadsheet chaos, broken VLOOKUPs, and 4-day variance reconciliations with an automated calculation engine—producing live multi-segment P&Ls, instant driver profit walks, and one-click regional Excel packs.
Inputs In 1 Standard
No emailed sheets; live submission tracking.
Volume vs. Mix Split
Isolates car units from high-trim variants.
1-Click Board Decks
Reconciled regional and ERP uploads.
forecast-engine.ctdtechs.com
LIVE ENGINE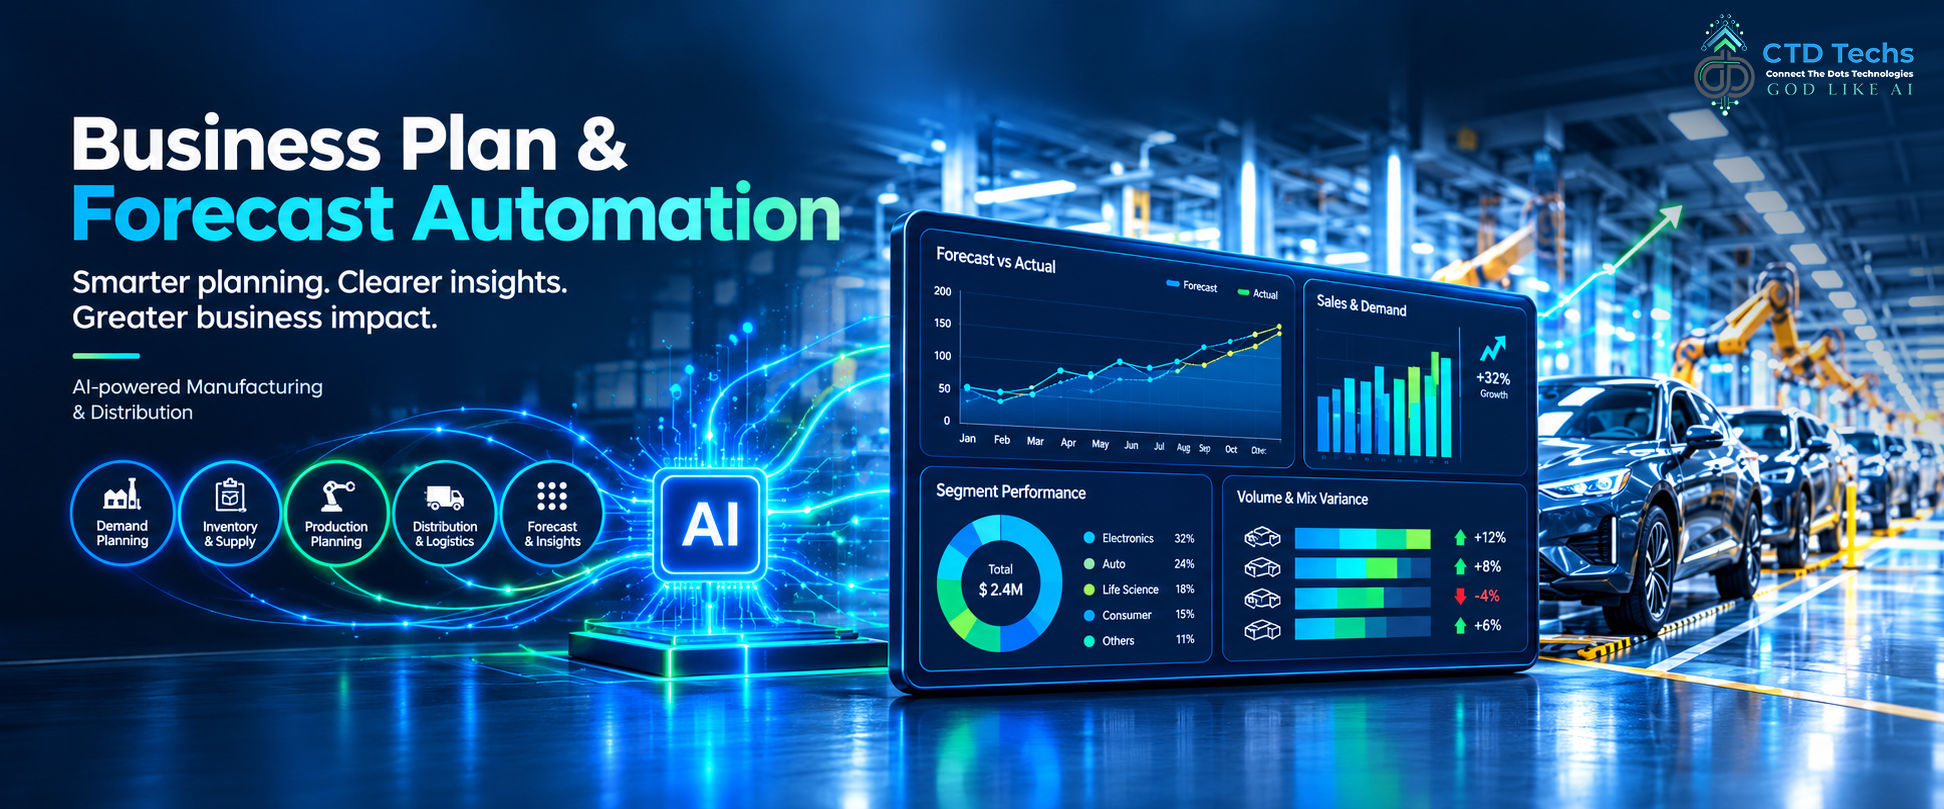
Reconciled with SAP General Ledger
100% Match5
Business Segments
Domestic, Export, After Sales, South Asia & CKD
1000s
Planning Rows
Decomposed by vehicle model, variant, and market
3
Reporting Audiences
Executive Board, Regional HQ & Group Consolidation
1 Click
Publish & Profit Walk
Instant driver waterfall across any two plan cycles
The Operational Friction
Before: Every Number Moved by Hand Through Excel
The legacy process worked, but it depended on extreme manual effort from a handful of analysts and thousands of fragile spreadsheet links.
Inputs Arrive in Disparate Formats
Each department emailed isolated spreadsheets with varying column layouts, currencies, and formula structures.
Zero validation on entry
Manual Copy-Paste Consolidation
One lead finance person manually copied thousands of cells into linked workbooks to build the consolidated P&L.
3–4 days spent per forecast
Hard-to-Explain Variances
When operating profit moved, isolating vehicle volume from model mix or material cost spikes took days of manual math.
Delayed commercial strategy
Slow, Risky Fragmented Reporting
Executive board slides, regional Excel packs, and ERP system uploads were prepared in separate silos with high error risk.
Version control vulnerabilities
Automated Data Pipeline
After: One Platform from Input to Final Board Report
Each department submits its numbers once in standardized templates. The centralized engine calculates and publishes automatically.
01
1. Collect
Departments submit data via locked templates with live submission status tracking showing who has submitted.
Standard column formatting
Automated sanity checks
02
2. Calculate
Revenue, discounts, variable costs, direct labour, and operating profit are computed automatically across all 5 segments.
Zero manual formula breaks
Sub-second recalculation
03
3. Analyse
Compare any two plans, rolling forecasts, or historical periods and immediately see the drivers behind variance.
Volume vs. Mix decomposition
Interactive profit walk bridge
04
4. Publish
Generate executive board slides, regional headquarters Excel packs, and ERP data feeds in a single coordinated click.
100% reconciled reports
Formatted regional templates
EXECUTIVE VARIANCE INTELLIGENCE
The Profit Walk Answers: “Why Did Profit Change?”
Operating profit variance bridge, illustrative (Indexed: Last Plan = 100). Click any driver bar to inspect attribution.
Baseline Index: Last Plan = 100|Target Index: New Plan = 109 (+9 pts)
Positive Driver Negative Driver Plan Benchmark
100Last Plan
+18 ptsVolume Effect
+7 ptsModel Mix
+9 ptsPrice Realization
-8 ptsTrade Discounts
-12 ptsRaw Material Costs
-5 ptsLabour & Overhead
109New Plan
Selected Driver: Volume Effect
Gross margin expanded through higher aggregate vehicle unit sales
+42,000 net units delivered across domestic and export dealer channels.
Variance Impact+18 pts
Read it Left to Right in Seconds
Start from the previous plan’s operating profit. Each bar isolates one driver: green adds profit, red takes it away. The final bar is the approved new plan. What used to take days of manual mix math is generated automatically for any pair of plans, forecasts, or actuals.
Volume and Model Mix Disaggregation
Separates unit volume (selling more vehicles) from model mix (selling a richer proportion of high-margin SUV variants vs. entry models), preventing misleading revenue assumptions during board reviews.
Multi-Segment Scope
5 Dedicated Business Segments on One Unified Engine
Each segment runs its own bespoke operational model with custom pricing and margin rules, while consolidating seamlessly into corporate reporting.
Segment Profile
Domestic Vehicle Sales
Core domestic wholesale operations covering 450+ dealership networks, consumer retail financing, and national fleet accounts.
+11.4% YoY
Projected Units240,000 Units
Gross Revenue$3.40 Billion
EBIT Margin14.2% EBIT
Forecast Cadence5M Actuals + 7M Rolling Monthly Forecast
Model Lineup Mapped: Sedans, C-SUVs, Commercial LCVs & Urban EVs
TRANSFORMATION MATRIX
What Changes for the Finance & Business Teams
Measurable workflow comparison across planning and reporting cycles.
| Planning Area | Before (Spreadsheet Silos) | After (Automated CTD Platform) |
|---|---|---|
| Collecting Inputs | Spreadsheets by email, chased one-by-one | Standard upload with live submission status |
| Building the P&L | Manual copy-paste into linked workbooks | Calculated automatically, by segment |
| Explaining Variances | Days of manual mix math to isolate drivers | Profit walk for any two periods on demand |
| Reporting | Slides, Excel pack and uploads made separately | Dashboards and one-click exports |
| Control & Governance | Knowledge sits with a few people; formula risk | Audit trail, versions and role-based access |
DELIVERY MODELS
Flexible Ways to Deliver the Platform
We recommend the delivery model that fits your enterprise tech stack, data security guidelines, and budget.
Recommended
Schedule Architecture ReviewCustom Web Portal
Bespoke FP&A platform built precisely around your operational segments and approval hierarchy.
Zero per-user license fees
Hosted in your own cloud (AWS / Azure)
Built around your exact process
Role-based access control & audit trail
If You Already Own Licences
Discuss BI IntegrationBI Tool Dashboards
Embedded calculation backend feeding your existing enterprise Power BI or Tableau reporting assets.
Uses existing tools like Power BI
Familiar executive dashboard view
Automated backend calculation model
Standard per-user BI licensing applies
Lightest Change
Discuss Excel ModelEnhanced Excel
Standardized, cloud-connected spreadsheet add-ins with locked input ranges and centralized computation.
Standard linked templates
Minimal user retraining required
Central calculation service
Gradual migration pathway
ENTERPRISE FP&A TRANSFORMATION
Does Your Finance Team Still Plan in Spreadsheets?
This modular automation framework fits any enterprise planning across multiple products, customer segments, or geographic regions. Let’s evaluate your financial planning workflow together.
✓ 30-min tailored technical discovery✓ Strict Mutual NDA✓ Proven in Tier-1 automotive manufacturing
Interactive Avatar

India
 CTD Techs Pvt. Ltd,
Kochar Bliss, 4th Floor, Guindy, Chennai, India - 600032
salesqueries@ctdtechs.ai
+91-9384699691
USA
 Connect The Health Dots,
225 Dyer Street, Providence, RI, 02903, USA
salesqueries@ctdtechs.ai
Canada
 Connect The Intelligence Dots,
BHive, 8 Nelson St W, Brampton, Ontario, L6X 1B7
salesqueries@ctdtechs.ai
+91-9150064825
Saudi Arabia
 Office 97, Bayt 7 Tower,
King Faisal Road,
Riyadh 12513
salesqueries@ctdtechs.ai
© 2026 CTD Techs, All Right Reserved.
DPDPA COMPLIANTEnsuring data privacy, consent, and governance at every step.